Recent Posts

Advanced Chart Patterns – Head and Shoulders Double Tops and Beyond

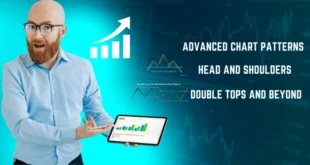
Head and Shoulders chart formation is an indicator that foretells of an impending change in trend from bullish to bearish direction, usually found on intraday, daily and weekly charts. Developing this chart formation occurs when price rises sharply before falling back down again. The pattern features two shoulders; however, one of which is higher than the other. Double Tops The …

Read More »

The Ultimate Guide to Trading With Trend Lines and Moving Averages

Trend lines and moving averages are powerful tools in any trader’s arsenal. By helping to streamline price data, they enable traders to more quickly identify trends while filtering out those that don’t go in their desired direction. Moving averages can act as an effective measure to identify stocks’ trends and gauge whether or not an important point in their development …

Read More »

Discovering Profitable Divergences and Hidden Trading Opportunities

Finding Divergences and Hidden Trading Opportunities Successful trading strategies focus on finding indicators that signal trend reversal – usually momentum indicators. However, traders should not disregard other indicator signals such as divergences as these could help identify trend changes earlier and create potentially more lucrative entry and exit points. How to find a divergence Divergences can be invaluable tools in …

Read More »